One of the early stars of the Indian E-tail story, I have decided to value Snapdeal next. With online retail being touted as the next big thing, It will be interesting to see if the narrative and numbers hold up together or there is a significant disconnect between my Intrinsic value for Snapdeal and VC value. I will be donning the hat of a prospective VC investor for my analysis.
Size of the Market
I again rely on eMarketer's estimates to gauge the size of the E-tail market in India. A good thing about their data is they have segregated the estimates of the online retail market from the total E-Commerce market. This is pretty useful as more than 70% of the E-Commerce market in India consists of travel sales.

As shown by the above data which is based Gross Merchandise Value numbers, online retail market is 1.6% of the total retail market i.e. $13.31 Billion (Rs. 853.7 Billion). Over the 5 year period from 2015-2020, the market is expected to grow at an annualized growth rate of 42.94%. Moreover, Mobile E-Commerce is expected to be the strong driver of growth:

Key observations regarding Industry and Company
1.The "GMV" Illusion: The number being thrown around all the time in E-Commerce and online retail specifically: Gross Merchandise Value. This is essentially the value of goods and services sold over a period of time (Not the price at which you sell them i.e. sales figure). For a pure marketplace model like Snapdeal, Revenues will be a percentage of GMV as a result of commission charged from sellers. Therefore, Value enhancement will only transpire if GMV translates into higher revenues which further lead to higher margins. Companies will surely be priced as a multiple of GMV in the market but I will try not to be distracted by it and keep my focus on revenues and margins.
2.Deep Discounting: The Marijuana Effect: The deep discounting phenomenon has become a part of the industry structure but comes with its own perils. I believe discounting rather than convenience of shopping online has been the primary reason for skyrocketing growth in the online retail industry. This has lured in shoppers in huge numbers at the expense of offline retail. However, this comes at a steep cost of diminished pricing power. In an industry with no significant barriers to entry, cutthroat competition and lot of substitutes, positive margins will be hard to come by as customers chase discounts and when the folk next to you is ready to lose money, only bad things happen (Flipkart example). Discounts are like Marijuana: Once your customers get addicted, it's very hard to get them off it.
3.The wars to come: The 3 big players i.e. Flipkart, Snapdeal and Amazon all are in a growth frenzy, have access to ton of capital and are willing to lose money in order to outdo the other. After a flop show in China, Amazon has come out all guns blazing to capture the gigantic Indian market although it is late to the party (This Fortune article brilliantly summarizes the Amazon Invasion). Moreover, with offline retailers planning to set up their own online portals to get a piece of the pie, it is time to dig deep trenches with capital cushions and weather the inevitable storm.
4.The "Other Expense" Disguise: What particularly stands out on Snapdeal's income statement is the mind boggling other expenses of Rs.1.8 Billion. Luckily for me, they do break out the components of other expenses in their report and lo and behold, advertising promotional expenses comprise the majority chunk i.e. Rs 1.05 Billion (almost a 10 fold increase from last year). This figure would include the discounts bundled to the sellers as well as heavy print, TV and digital advertising by the company.
I also had a look at the current market share of the largest players in the market:

Since revenue numbers are not available on an industry level, I had to work with GMV numbers. As per latest numbers, Flipkart is the market share with a 30% market share. Snapdeal has already lost its number 2 position to Amazon and even Paytm has overtaken it. I also computed Revenues as a percentage of GMV number to get a sense of the conversion rate. All these numbers above are rough estimates which I got my hands on through various news stories and google search.
Considering the not so insightful observations above, my narrative for Snapdeal is as follows:
Snapdeal is an online marketplace operating in an industry with high competition. Low pricing power and low barriers to entry will only enable Snapdeal to maintain it's current market share as the market size expands.
The Number Crunching
1. Revenues
I have assumed revenues of Rs 359.50 Billion for Snapdeal in Year 10. The way I come up with that number is listed below:
1. I have assumed a 5 year high growth phase for the industry. As discounts start to wither out, the growth rate in GMV will decline. The growth rate for the industry in the future will be a function of internet penetration (huge infrastructure investments), Banking penetration(as Cash on Delivery is eventually phased out) and higher disposable income among consumers. While these all can probably happen, I believe there are a lot of combination of factors here at play along with roadblocks in terms of quality of internet access (speed and continuous access). Therefore, drawing on eMarketer's estimates till year 5 and reducing the growth rate to economy growth rate from Year 6 to Year 10, I get a market size of $136.89 Billion (Rs 8,780 Billion).
2. With Snapdeal, I assume the same growth pattern as for the industry: 5 years high growth phase followed by a linear decline to economy growth in perpetuity. With Snapdeal losing market share to Amazon and Paytm, The best case for the company will be to consolidate it's market share as focus shifts from GMV to margins. I have assumed the current GMV market share for the company in Year 5 i.e. 10%. Thus, My Year 5 GMV market share for Snapdeal is $7.94 Billion. Building on this, I give them a conversion rate of 20% in Year 5. I am implicitly assuming that they will translate more of GMV into revenues sooner than later. Hence, I am assuming a Revenue CAGR of 67.79% from Year 1 to Year 5 and then linearly decline the growth rate to economy growth rate of 4.69%. I finally end up with a revenue figure of Rs 359.54 Billion in Year 10.
How comfortable am I with these numbers? Assuming a modest revenue conversion rate of 30% in Year 10, The total market size by revenue will be Rs 2400 Billion. This gives me a market share of 15% by revenue in Year 10 for Snapdeal and I can live with that number. Can I be wrong? Of course! Will I be wrong? Most probably. But I take solace in the fact that bankers and consultancy firms are also pretty unsure about the size of the market which is a key driver. (Check this out)
2. Margins
I ran into a bottleneck while coming up with an estimate for operating margin in Year 10: Which classification is more suitable for the company: Online Retail or Internet Software? I made a judgement call and have considered it as an internet software company. Operating as a pure online marketplace, the company has more in common with a company such as Ebay rather than a retail company. I give them an operating margin of 20.68% in Year 10 i.e. the average operating margin of internet software firms globally.
3. Reinvestment
To come up with reinvestment number, I have assumed a sales to capital ratio of 1.50 for Snapdeal. This number is higher than the global industry average of 0.78 and emerging markets industry average of 1.06. I am implicitly assuming that the company will become increasingly efficient in generating revenue for every Rupee in invested capital (Although this is more of leap of faith than anything else).
Cost of Capital

Stable Growth Assumptions
1. Growth Rate- The growth rate in perpetuity has been set equal to the risk free rate i.e. 4.69%.
2. Cost of Capital- I assume that debt and equity weights will converge to industry average weights of 4.43% and 95.57% respectively. I also assume that Snapdeal will have more borrowing capacity as it starts to make money and hence decline the company default spread to 2.44% (the default spread for Baa3 rating i.e. the current sovereign rating for India). This leads to a decline in the cost of capital from 17.92% to a cost of capital of 14.19% in perpetuity.(linear decline from Year 5 to Year 10).
Value of Firm and Equity
Discounting the Free cash flows at the cost of capital gives a value of operating assets of Rs 26.16 Billion. This is the value of Snapdeal based on standalone numbers. As per financial statements, they have 6 subsidiaries and 1 Joint Venture. I convert the book value of these subsidiaries into market values using the average Price to Book ratio for the sectors in which they operate. This process yields a value of Rs 2.2 Billion for the subsidiaries. Subtracting the market value of debt and adding the value of subsidiaries to the value of operating assets along with cash and liquid investments worth Rs 32.8 Billion gives a value of equity of Rs 60.96 Billion. In dollar terms, The Value of equity is $950 Million.
Factoring in the Uncertainty
1.Implied Variables
As per news reports, Snapdeal is being currently valued at $6.5 Billion (Rs 416 Billion). To come up with this value, I backed out the operating margins and Revenues in Year 10 that were being implicitly assumed using goal seek. The implied revenue figure comes out to be Rs 3,687 Billion and implied operating margin is 71.87%. Given my narrative and estimates of market size, Revenues of $57 Billion and such a high operating margin are highly unlikely given the high competition and low barriers to entry.
2. Data Table
I used revenues and operating margins as my two variables in the data table:
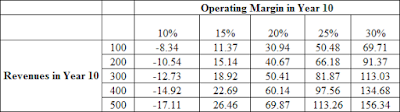
Even with a highly optimistic scenario, Snapdeal's value will be Rs 156.34 Billion or $2.43 Billion. This falls way short of the current $6.5 Billion valuation being attached. I believe the size of the market will play a crucial role in determining revenues and value for Snapdeal. I am comfortable with my margin assumption of 20.68%, which to be honest is still a bit optimistic.
3. Monte Carlo Simulation
To capture variations in my assumptions, I did a Monte Carlo Simulation wherein I gave a Triangular Distribution to both Year 5 Market Size (This is the number everyone is uncertain about) and Operating Margins in Year 10. Because I gave a distribution to market size in Year 5, this implicitly checks for changes in my revenue numbers as well. After 1,000,000 simulations, I get a average value of Rs 56.92 Billion and there is a 80% certainty that the value will lie between Rs 36.16 Billion and Rs 79.36 Billion.

Final Thoughts
As per my narrative and numbers, Another startup fails the Unicorn test although not by much. I believe these are testing times for the company as well as the industry as everyone is hell bent on "Winner takes all" approach. I do not think the industry as a whole will not disappear, they do have changed the way we purchase products. However, How quickly will the players be able to shift focus from lack of sustainable competitive advantages like discounting to actual competitive advantages like convenience and quick delivery will be the key for future growth. I will be looking forward to get my hands on any updated numbers for the company or any narrative changes which might force me to revisit my valuation again.
Link to Valuation Model
Note: Please do not consider any content on this blog as an investment recommendation or advice. At the time of posting of this article, I do not have any financial interest in the company being analyzed. The views reflected in this blog are my personal views and have been arrived at using public information sources.
Size of the Market
I again rely on eMarketer's estimates to gauge the size of the E-tail market in India. A good thing about their data is they have segregated the estimates of the online retail market from the total E-Commerce market. This is pretty useful as more than 70% of the E-Commerce market in India consists of travel sales.

As shown by the above data which is based Gross Merchandise Value numbers, online retail market is 1.6% of the total retail market i.e. $13.31 Billion (Rs. 853.7 Billion). Over the 5 year period from 2015-2020, the market is expected to grow at an annualized growth rate of 42.94%. Moreover, Mobile E-Commerce is expected to be the strong driver of growth:

Key observations regarding Industry and Company
1.The "GMV" Illusion: The number being thrown around all the time in E-Commerce and online retail specifically: Gross Merchandise Value. This is essentially the value of goods and services sold over a period of time (Not the price at which you sell them i.e. sales figure). For a pure marketplace model like Snapdeal, Revenues will be a percentage of GMV as a result of commission charged from sellers. Therefore, Value enhancement will only transpire if GMV translates into higher revenues which further lead to higher margins. Companies will surely be priced as a multiple of GMV in the market but I will try not to be distracted by it and keep my focus on revenues and margins.
2.Deep Discounting: The Marijuana Effect: The deep discounting phenomenon has become a part of the industry structure but comes with its own perils. I believe discounting rather than convenience of shopping online has been the primary reason for skyrocketing growth in the online retail industry. This has lured in shoppers in huge numbers at the expense of offline retail. However, this comes at a steep cost of diminished pricing power. In an industry with no significant barriers to entry, cutthroat competition and lot of substitutes, positive margins will be hard to come by as customers chase discounts and when the folk next to you is ready to lose money, only bad things happen (Flipkart example). Discounts are like Marijuana: Once your customers get addicted, it's very hard to get them off it.
3.The wars to come: The 3 big players i.e. Flipkart, Snapdeal and Amazon all are in a growth frenzy, have access to ton of capital and are willing to lose money in order to outdo the other. After a flop show in China, Amazon has come out all guns blazing to capture the gigantic Indian market although it is late to the party (This Fortune article brilliantly summarizes the Amazon Invasion). Moreover, with offline retailers planning to set up their own online portals to get a piece of the pie, it is time to dig deep trenches with capital cushions and weather the inevitable storm.
4.The "Other Expense" Disguise: What particularly stands out on Snapdeal's income statement is the mind boggling other expenses of Rs.1.8 Billion. Luckily for me, they do break out the components of other expenses in their report and lo and behold, advertising promotional expenses comprise the majority chunk i.e. Rs 1.05 Billion (almost a 10 fold increase from last year). This figure would include the discounts bundled to the sellers as well as heavy print, TV and digital advertising by the company.
I also had a look at the current market share of the largest players in the market:

Since revenue numbers are not available on an industry level, I had to work with GMV numbers. As per latest numbers, Flipkart is the market share with a 30% market share. Snapdeal has already lost its number 2 position to Amazon and even Paytm has overtaken it. I also computed Revenues as a percentage of GMV number to get a sense of the conversion rate. All these numbers above are rough estimates which I got my hands on through various news stories and google search.
Considering the not so insightful observations above, my narrative for Snapdeal is as follows:
Snapdeal is an online marketplace operating in an industry with high competition. Low pricing power and low barriers to entry will only enable Snapdeal to maintain it's current market share as the market size expands.
The Number Crunching
1. Revenues
I have assumed revenues of Rs 359.50 Billion for Snapdeal in Year 10. The way I come up with that number is listed below:
1. I have assumed a 5 year high growth phase for the industry. As discounts start to wither out, the growth rate in GMV will decline. The growth rate for the industry in the future will be a function of internet penetration (huge infrastructure investments), Banking penetration(as Cash on Delivery is eventually phased out) and higher disposable income among consumers. While these all can probably happen, I believe there are a lot of combination of factors here at play along with roadblocks in terms of quality of internet access (speed and continuous access). Therefore, drawing on eMarketer's estimates till year 5 and reducing the growth rate to economy growth rate from Year 6 to Year 10, I get a market size of $136.89 Billion (Rs 8,780 Billion).
2. With Snapdeal, I assume the same growth pattern as for the industry: 5 years high growth phase followed by a linear decline to economy growth in perpetuity. With Snapdeal losing market share to Amazon and Paytm, The best case for the company will be to consolidate it's market share as focus shifts from GMV to margins. I have assumed the current GMV market share for the company in Year 5 i.e. 10%. Thus, My Year 5 GMV market share for Snapdeal is $7.94 Billion. Building on this, I give them a conversion rate of 20% in Year 5. I am implicitly assuming that they will translate more of GMV into revenues sooner than later. Hence, I am assuming a Revenue CAGR of 67.79% from Year 1 to Year 5 and then linearly decline the growth rate to economy growth rate of 4.69%. I finally end up with a revenue figure of Rs 359.54 Billion in Year 10.
How comfortable am I with these numbers? Assuming a modest revenue conversion rate of 30% in Year 10, The total market size by revenue will be Rs 2400 Billion. This gives me a market share of 15% by revenue in Year 10 for Snapdeal and I can live with that number. Can I be wrong? Of course! Will I be wrong? Most probably. But I take solace in the fact that bankers and consultancy firms are also pretty unsure about the size of the market which is a key driver. (Check this out)
2. Margins
I ran into a bottleneck while coming up with an estimate for operating margin in Year 10: Which classification is more suitable for the company: Online Retail or Internet Software? I made a judgement call and have considered it as an internet software company. Operating as a pure online marketplace, the company has more in common with a company such as Ebay rather than a retail company. I give them an operating margin of 20.68% in Year 10 i.e. the average operating margin of internet software firms globally.
3. Reinvestment
To come up with reinvestment number, I have assumed a sales to capital ratio of 1.50 for Snapdeal. This number is higher than the global industry average of 0.78 and emerging markets industry average of 1.06. I am implicitly assuming that the company will become increasingly efficient in generating revenue for every Rupee in invested capital (Although this is more of leap of faith than anything else).
Cost of Capital

Stable Growth Assumptions
1. Growth Rate- The growth rate in perpetuity has been set equal to the risk free rate i.e. 4.69%.
2. Cost of Capital- I assume that debt and equity weights will converge to industry average weights of 4.43% and 95.57% respectively. I also assume that Snapdeal will have more borrowing capacity as it starts to make money and hence decline the company default spread to 2.44% (the default spread for Baa3 rating i.e. the current sovereign rating for India). This leads to a decline in the cost of capital from 17.92% to a cost of capital of 14.19% in perpetuity.(linear decline from Year 5 to Year 10).
Value of Firm and Equity
Discounting the Free cash flows at the cost of capital gives a value of operating assets of Rs 26.16 Billion. This is the value of Snapdeal based on standalone numbers. As per financial statements, they have 6 subsidiaries and 1 Joint Venture. I convert the book value of these subsidiaries into market values using the average Price to Book ratio for the sectors in which they operate. This process yields a value of Rs 2.2 Billion for the subsidiaries. Subtracting the market value of debt and adding the value of subsidiaries to the value of operating assets along with cash and liquid investments worth Rs 32.8 Billion gives a value of equity of Rs 60.96 Billion. In dollar terms, The Value of equity is $950 Million.
Factoring in the Uncertainty
1.Implied Variables
As per news reports, Snapdeal is being currently valued at $6.5 Billion (Rs 416 Billion). To come up with this value, I backed out the operating margins and Revenues in Year 10 that were being implicitly assumed using goal seek. The implied revenue figure comes out to be Rs 3,687 Billion and implied operating margin is 71.87%. Given my narrative and estimates of market size, Revenues of $57 Billion and such a high operating margin are highly unlikely given the high competition and low barriers to entry.
2. Data Table
I used revenues and operating margins as my two variables in the data table:
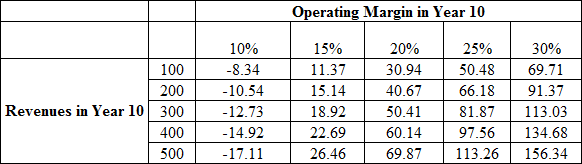
Even with a highly optimistic scenario, Snapdeal's value will be Rs 156.34 Billion or $2.43 Billion. This falls way short of the current $6.5 Billion valuation being attached. I believe the size of the market will play a crucial role in determining revenues and value for Snapdeal. I am comfortable with my margin assumption of 20.68%, which to be honest is still a bit optimistic.
3. Monte Carlo Simulation
To capture variations in my assumptions, I did a Monte Carlo Simulation wherein I gave a Triangular Distribution to both Year 5 Market Size (This is the number everyone is uncertain about) and Operating Margins in Year 10. Because I gave a distribution to market size in Year 5, this implicitly checks for changes in my revenue numbers as well. After 1,000,000 simulations, I get a average value of Rs 56.92 Billion and there is a 80% certainty that the value will lie between Rs 36.16 Billion and Rs 79.36 Billion.

Final Thoughts
As per my narrative and numbers, Another startup fails the Unicorn test although not by much. I believe these are testing times for the company as well as the industry as everyone is hell bent on "Winner takes all" approach. I do not think the industry as a whole will not disappear, they do have changed the way we purchase products. However, How quickly will the players be able to shift focus from lack of sustainable competitive advantages like discounting to actual competitive advantages like convenience and quick delivery will be the key for future growth. I will be looking forward to get my hands on any updated numbers for the company or any narrative changes which might force me to revisit my valuation again.
Link to Valuation Model
Note: Please do not consider any content on this blog as an investment recommendation or advice. At the time of posting of this article, I do not have any financial interest in the company being analyzed. The views reflected in this blog are my personal views and have been arrived at using public information sources.


