Wednesday, 31 August 2022

Sula Vineyards IPO: I drink and I know things

Sula Vineyards, an Indian wine company, filed for their IPO in July this year amidst the market turbulence. With new issuances hitting an all time low in H1 22, this is an interesting proposition for the Indian market after a bunch of disastrous tech IPO's over the last couple of years. The valuation is a going to be a steep learning curve for me- I am not a wine connoisseur and know very little about the dynamics of the wine market or the difference between a Chardonnay and a Sauvignon Blanc. However, this lack of information might not be a bad thing after all as it helps reduce my bias in the process. With that being said, I take inspiration from one of my favourite characters from Game of Thrones i.e. Tyrion Lannister ("I drink and I know things") and dive into the realm of value creation for Sula.

Company history and overview

Sula Vineyards was founded in 1999 by Rajeev Samant, an expat working with Oracle in the US who returned to India in the 90s. A visit to his native land in Nashik brought the idea of growing wine grapes which subsequently led to working in a small winery in California for 3 months and then translated into the birth of Sula- a wine company which would symbolize rich Indian heritage. Over the last few years, Sula has become the largest wine seller and producer in the country and captured a market share in excess of 50% and across variants i.e. red, white and sparkling through strong brand recognition and a diverse portfolio catering to different price points. Moreover, the company has been the dominant player across four price segments in the market through 56 wine labels and with high market share in the "Elite" and "Premium" category. 

The company generates revenues primarily through two sources: the "core business" which involves production, distribution and sale of wines and "wine tourism business" which is more of an experience complementing the core business and includes service revenues from wine tourism i.e. resorts and tasting rooms. This also reflects in the revenue split with wine tourism business generating less than 10% of revenues over across years. Below is the historical revenue trajectory along with split for revenue from operations reported by the company in the prospectus:


Note that revenue growth has declined due to the pandemic and lockdowns over last couple of years but the post COVID recovery is yet to be completed- F22 revenues are at 87% of pre-covid levels. The increased share of premium wines within the portfolio and strategic pivot to increase penetration of own brands vs third party brands drive the F22 sales growth.  The company also benefits from tax subsidy- a VAT benefit from the state of Maharashtra under Wine Incentive Promotion Subsidy scheme wherein 80% of the VAT paid is refunded which they have included as other operating revenues. With the bulk of installed capacity in the state, the increase in manufactured goods in the state is directly correlated to the incentive realised. 

In terms of inorganic growth, Sula has sparingly acquired assets of different wineries over the last 5 years with the acquisition of Heritage winery assets diversifying manufacturing operations to state of Karnataka with significantly lower taxes and duties. However, not all M&A activity has played out as intended with divestiture of majority stake in the beer business over last year. 

The wine market diagnostic

To get a sense of the potential growth opportunity for Sula, I start by looking at the estimates and consumption patterns for the alcohol beverages and wine market in India and globally. The global alcohol consumption is estimated to reach 6.6 litres in 2025 with spirits dominating in terms of pure alcohol contribution. However, beer is the most popular alcohol beverage from a consumption standpoint with wine and sprits almost at an equal standing. 

Source: Technopak analysis

The country view of alcohol consumption reveals some interesting insights. While most of the major developed nations have considerable wine consumption, the wine consumption for developing countries remains low. In case of India, the overall consumption of wine is less than 1% vs 13% global average with 90% consumption coming from spirits. The obvious comparison with China is tempting but reflects the stark difference between two countries- total consumption for China is 4x more than India and wine consumption is 40x higher. While the company argues and positions this as a huge growth opportunity, I'm cautious in sharing their optimism on swift changes in consumer tastes and preferences. China has a higher per capita disposable income and bulk of the sales occur through ecommerce online marketplaces which isn't the case in India. Moreover, there is evidence of lack of wine knowledge and a considerable learning curve resulting in fewer new wine drinkers entering the market which is going to be a significant barrier for the Indian market as well.


The Indian alcohol market size is estimated to be $33 Billion in 2020. While the overall market has declined in 2021, it is expected to grow at an annualised rate of 11% with the potential market size of $43 Billion in 2025. In terms of category, 2/3rd of the market is currently captured by Indian made foreign liquor (IMFL) followed by country liquor and beer. The Indian wine market, although nascent vs other beverages, is expected to grow at a CAGR of 20% from 2021 and reach a total value of $425 Million (INR 32 Billion) in 2025. Based on the information provided in the prospectus (pain in the neck with more than 400 pages) and google search, the key themes for the Indian wine industry can be summarised below:

+ High concentration across market share and consumption- The Indian 100% grape wine market is dominated by 2-3 players which contribute ~ 80% in value terms- Sula, Fratelli Wines and Grover Zampa. The top wine producing states of Maharashtra and Karnataka are also the top consuming states with ~ 57% of the total market. With the consumption heavily skewed, low penetration is a challenge with wine consumption predominately restricted to metro cities. This outlines the challenge of educating the consumers and creating awareness in Tier 1 cities and beyond which is going to be an uphill task.

+ Growth momentum driven by premium segment- The growth trajectory of the wine market over the last few years has been driven by the top end of the value spectrum (in sync with global trends) as cheaper fortified wines lose market share at the expense of 100% grapes wines. Based on the price  cohorts below, the elite and premium  segments are expected to outgrow other segments over the next 5 years with all major players addressing the demand through higher portfolio options of elite and premium wines.


+ On-trade vs Off-trade consumption- Alcohol consumption in India is primarily through two channels- On trade which refers to consumption at hotels and restaurants whereas Off trade sales occur through supermarkets and licensed liquor shops. While on-trade channel declined due to lockdowns, it is expected to gain prominence over the next few years in sync with premium segment growth. Wine pairing with food significantly leverages on trade channels and serves as first touchpoint for new wine consumers- an increase in on-trade wine consumption is expected to have a cascading sales impact on off-trade channel as well. 


+ Diminishing returns for foreign wine players - The share of imported wines has remained considerable with 17% of market in 2020 and projected decline to 13% in 2025. Australia is leading country of import in terms of volume and the rest of the market is fragmented. Imported wines face stiff challenge vs domestic players as high import duty of 150%  makes them less competitive. Alcohol giants like Diageo and Pernod Ricard have tried to locally manufacture wines and entered the domestic market but faced multiple roadblocks in penetration and scaling up and finally exited the space to focus on their spirts business.

+The labyrinthine of regulations- The regulatory complexity of Indian alcohol market cannot be understated. Each state has their own excise policy along with variation in legal drinking age limit and various duties etc. Moreover, advertising of alcoholic drinks is prohibited directly or indirectly in India which inhibits avenues to reach mass audiences through different media channels. This will be a considerable roadblock for alcoholic drinks like wine which require high consumer education to increase penetration.

Shaping the Sula business story

Before I explicitly lay out my narrative for Sula, I believe it's imperative to highlight the IPO issuance and use of subsequent proceeds. The company does not plan to issue any new shares with the offer of sale of 25.5 Million shares for existing investors in the company to cash out. This indicates that the company's confidence in the cash generation potential of the business to fund future growth at least in the short term and the listing largely providing access to capital markets and putting the wine business on the map.

While the company lays out plethora of information on the business nuances across the prospectus (which pulls you in different directions), the below points standout:

+ Production cycle and facilities- The harvest period for grapes is restricted to 4 months from December to March 2020 followed by fermentation and ageing. While the below info graph from the prospectus summarises the production process in a nutshell, two key things stand grab my attention: the long gestation period across the value chain especially for premium wines which are aged in oak barrels. The second thing which stems out is a high cash conversion cycle- the long gestation period would lead to a high days inventory outstanding which means a lot of cash of the business is tied down in working capital.


The manufacturing capabilities are spread across 6 wineries with all of them located in Maharashtra and Karnataka. With an installed capacity at 14.5 Million litres, capacity utilisation for FY22 at 80% post the lockdown drop to 65% in 2021 with resurgence and demand and additional supply through York Winery acquisition.

+ Procurement and Distribution- Sula has de-risked supply through execution of long-term grape contracts with farmers for up to 12 years for almost 84% of the vineyards. The company also has an expansive distribution network in play with presence in 25 states and 6 Union Territories in India. The sales channels are split through On-Trade, Off-Trade and Direct to customer sales through wine tourism business with secondary sales dominated by off-trade channels. On the Wine Tourism side, the company operates two vineyard resorts with sales driven by room revenue, F&B and sale of wine/liquor.

I also took a quick look at the financial summary provided and highlight the bridge to EBIT along with some key KPI's below:


Note that EBIT margin improvement from cost standpoint is largely driven by cost of goods improvement whereas most of the other components have not seen material variation over last three years. The strategic shift through discontinuation of third party unprofitable brands, cost rationalisation across raw materials and packaging and divestiture of PADPL, the beer and spirits subsidiary reasons drive this positive trend. The upward margin trajectory is slightly offset in FY22 by higher other operating and wine processing expenses. Something that sticks out though is the cash conversion trajectory-  large chunks of capital remains tied in inventory and payables with average cash conversion time worsening over time. The other key insight is that the company currently generates returns below the cost of capital- something that I need to keep in mind while building my endgame.

After an exhausting prospectus read and google search to get a flavour of the business and industry, I have the foundation for my Sula narrative which will play out across the following dimensions:

+ Market dominance through mainstream wine adoption- Sula's initial foray in the wine market over 26 years back and subsequent transformation of wine has enabled it to be a market leader in the domestic wine industry with strong competitive advantages across the value chain and a product portfolio that caters to the entire wine market. With a wide distribution network and strong penetration through on-trade and off-trade routes, I expect them to consolidate their market leadership going forward at the expense of other domestic players i.e. Grover Zampa and Fratelli wines which only have 10% of installed capacity vs Sula.

+ Industry tailwinds and strategy shift to drive margin uplift- The transition of industry trends and company product mix to premium wine categories should drive higher profitability going forward (in line with last 3 years) along with cost efficiencies. However, this also creates a dilemma- will the high premium prices be a stumbling block to market expansion, especially in a price sensitive market like India which is highly dominated by spirits? The company would also directly compete with foreign wines which might 

+ Imported wines: Trade deals to drive resurgence? While the share of imported wines has been low, there might be an impetus in the next 5-10 years with import duties drastically reducing for the same. A case in point here is Australia: with the recent Australian-India free trade pact signed, the duties on imported Australian wines go down significantly after the pact is enabled which makes them highly price competitive to elite and premium offerings from Sula. The good news for Sula is that the impact of this change might be diluted by the fact that major tax reduction comes only after 10 years.

+ Customer penetration: Between rock and a hard place Wine market expansion is critical for Sula to achieve it's growth ambition but customer education is going to be an uphill task. To Sula's credit, they have tried to workaround the mass media advertising prohibition through innovative marketing concepts and live experiences like wine tourism business, product placement in TV shows and Sula festival. But the fact remains that most of the consumption is concentrated in a few metro cities with very low penetration beyond. With wine already behind the eight ball to spirits in India, Sula will have to continue to evolve selling proposition of wine vs other alcohols and leverage new avenues for customer outreach and consumption.

The Sula Narrative

"Sula is a wine company which will maintain its leadership in a growing market through brand recognition, scale and competitive advantages across the value chain. The company is well positioned to drive higher profitability through pivot from value to premium segments along with  industry tailwinds. Capital intensity will remain high but move towards industry average over time and default risk remains low. While Sula will continue to drive visibility through experience driven marketing, the steep learning curve for wines and limited wine penetration beyond major cities will remain significant hurdles  vs other alcoholic beverages" 

Connecting the numbers


+ Revenue growth- The growth estimates for Sula are primarily driven by two key assumptions- the size of the wine industry and company's market share. As per the prospectus, the domestic wine industry is expected to grow at a CAGR of 23% from 2021 with total market size of INR 25 Billion in 2025. Based on my narrative, I assume that the company will continue to be the market leader, and give them a market share of 55% in 2025. In rupee terms, this implies revenues of 13.8 Billion which transitions to grow at economy growth rate of 4.6% in year 10. Over a 10 year horizon, revenues increase by almost 10x to INR 39 Billion. This might be a bit optimistic but I believe that if the market size grows as expected, then Sula should be able to capture a large piece of the pie based on their market position vs competition. 

+ Operating margins-  The current pre-tax operating margins for Sula are ~ 22%. For the endgame, I assume a pre-tax operating margin of 28% in year 10 which is in-line with the average margin for alcoholic beverage companies. This is not a clean sample based number as it will have mix of companies with different alcohol businesses rather than pure-play wine companies but hopefully the larger sample should work in my favour. The shift to higher end spectrum of wine portfolio propelled by changes in industry dynamics and pricing power by leveraging it's brand name should help Sula further accelerate profit trajectory. To keep things simplistic, I assume that margins follows a linear increase towards the target margin over the 10 year forecast period.  

+ Reinvestment- The proxy for reinvestment would be capital turnover ratio and  the wine business is quite capital intensive with high working capital requirements. The current sales to capital ratio for Sula is 0.7 which means that for every rupee invested in the business, the company generates 0.7 rupees in sales. I assume the ratio to stay constant at 0.7 initially but eventually transition to 1.3 in year 10. While ROIC is below cost of capital currently, the higher capital efficiency along with margin improvement means that I am assuming a positive ROIC-WACC value spread of ~ 7% in perpetuity, in line with industry averages.

Cost of Capital


The cost of capital for Sula is 12.4% in Indian rupees. Note that the key input of market value of equity of INR 37.5 Billion is based on media reports which expect avg. proceeds of INR 12-14K Million from sale of 25.5 million shares as the IPO has not been priced yet by the bankers.  I pay homage to the old saying of "when in doubt- take averages" and use an average of this range to come up with the market value of equity. Post the high growth period, the cost of capital declines to median cost of capital of 11.2% for Indian companies.

From operating value to equity value


Using a 10 year explicit forecast period, I project out the free cash flows for first 5 years of high growth, transition period from year 6-10 and stable growth period post 10. For the terminal value, growth is capped at the current risk free rate i.e. 4.6%, ROIC of ~ 19% and cost of capital of ~ 11%. The value of operating assets is INR 26.5 Billion. Subtracting out debt and adding back cash and equivalents leads to a value of equity of INR 24.2 Billion. Taking out the value of options and dividing by the shares outstanding gives me a value per share of  INR 300 which is 37% lower than the expected IPO price as per media reports of INR 478 per share. The pricing number might be refined once the book building process is over but based on my narrative there is a clear gap between price and value.

Factoring in the uncertainty


To capture the the risk in my key value driver assumptions, I looked at various combinations of revenue growth in the high growth phase and target operating margin in year 10 which solve for the current value per share. Note that the base case assumes ~ 34% growth at expected margins of ~ 28% for value of INR 300 per share. Is the speculated price of INR 478 possible? Of course! But to deliver those expectations, Sula will need to generate annualised growth of 40%+ in first five years and target margins of 28%+ in Year 10 and beyond. In my opinion, this would be hard to achieve as there will be roadblocks in terms of existing consumer preferences towards spirit and beer and limits to cost efficiencies.

To further capture the volatility in my key assumptions, I did a Monte Carlo simulation by assigning distributions to overall market size (lognormal), market share (triangular) and operating margin in year 10 (uniform). This helps me in incorporating the wide values around these key variables rather than just point estimates. After 500K simulations, the median share price of INR 247 which is below my base case value of INR 300. Based on my assumptions, the expected IPO price is close to 95th percentile of the distribution. There are possibilities to achieve this price but the pathways remain slim at best. 

Final thoughts

The Sula IPO is an exception for the Indian markets rather than the norm: with a bunch of young money losing tech/fintech start-ups going public recently, this is a company which has a couple of decades of history behind it and a successful (profitable) track record of scaling the wine business. The next phase of publicly listing in the markets will be a challenging one- the company isn't tapping the market for capital yet but will be under the performance lens every quarter. It will also be interesting to see the price band of the IPO which should be out in the next few weeks and might warrant an update to my market value of equity. The rationale of buying into the Sula story is the strong brand recall and allure of the potential Indian market and parallels to growth in China. However, the expected IPO price based on media reports is still too rich even after factoring in the optimism in the story and the numbers. I am intrigued to see how these variables play out on the street. In the meantime, I'll sign out of this valuation for now (with a glass of whisky by my side).
 

Note: The content on this blog reflects the personal views of the author and should not be considered as an investment advice or recommendation. 


Wednesday, 3 August 2022

Bumble Valuation: Swipe left to invest?

After a hiatus of 5 years, I finally decided to restart my blog by valuing Bumble, a key player in the sprawling online dating space. The company has been around 2014 but went public in Feb 2021 and raised $2.2 Billion with investor expectations propelling the stock price to almost 2x of the IPO asking price. However, shareholder returns have witnessed a steep decline over the last year shaped by reality of business fundamentals along with macro headwinds. With the 2021 financials and 2022 10-Q filing out a few days back, I put my valuation hat on and drive the intrinsic valuation journey of the company by linking the business narrative and numbers and hopefully mitigating my bias in the process.

Company background

Bumble started in 2014 as an alternative to the widely popular Tinder app which revolutionized the dating app scene by bringing the quintessential "swipe feature". Interestingly, the company's CEO worked for Tinder due to differences and collaborated with founder of Badoo, another dating app, to launch the company) The company's value proposition is simple: given the unpleasant experiences and unwanted advances faced by females on dating apps, only female users can initiate conversations in heterosexual matches. This was a deliberate attempt to distinguish from Tinder, which over the years has gained the notorious distinction of being the "hook-up app". Studies have also backed up Bumble's focus on female user experience: a 2019 survey showed women across most age groups are far more likely to be at the receiving end of offensive statements and unsolicited pictures.

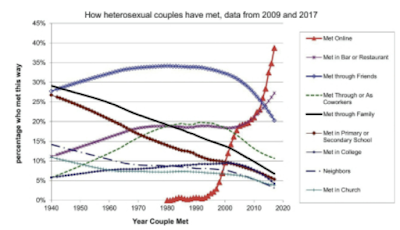
While the female centric focus resonated with users, the paradigm shift in lifestyle and consumer behaviour tailwinds further accelerated adoption rates across online dating industry over the last decade. With technology getting more intertwined with our lives along with higher penetration of smartphone and internet access, there has been a significant shift with couples ditching traditional ways of meeting- 2 out 5 couples met through online platforms.


Shareholder returns and operating performance

To get a quick performance overview, I start with looking at the shareholder returns post listing. Stock price has plummeted over the last year with Bumble losing almost 70% of it's IPO price and underperforming the broader market whereas it's main rival Match group has declined by almost 33%. Market expectations have become more measured as the resurgence of COVID-19 and lockdowns have kept users at home along with more spotlight on paying users and conversion rate. There has been a spike in the stock price post Q1 F22 results with the company exceeding wall street expectations on addition of new paying users.


Bumble and sister app Badoo essentially operate on a subscription ("freemium") model: the service is free to use but users have to pay for premium features and in-app purchases. Subscription ranges from 7 days to 180 days and in-app purchases allow both subscribers and non-subscribers to leverage on specific features to boost matches.  Apart from the dating profile, there is also the BFF feature for platonic connections and Bizz for professional networking. Badoo follows a similar approach and is more popular across Europe and Latin America. 


Revenue growth trajectory has been strong with an increase of more than 2x over last 4 years. However, the path to profitability has been volatile, after capitalising R&D costs and adjusting for non-operating items. The key operating metric here is paying subscribers average revenue per paying users (ARPPU). The stock price has spiked post Q1 2022 results with market rewarding the higher than anticipated total paying users of 3.0 Mn. Note that while Bumble has a better user monetisation and conversion compared to Match, they lag on profitability with high operating costs tied to selling and advertising through digital channels. Also, while the number of Badoo subscribers are higher than Bumble, the value of a bumble user is more than double with ARPU of $30 vs $13 for Badoo. While this drags the overall monetization, another key factor would be the split of users across geographies and change over time as pricing variations come into play. For e.g.  a Bumble user in the US pays $19.99 per month whereas in India it's less than $10 per month. Unfortunately, this information is not disclosed by the company across filings but the geography split gives a directional sense of the delta in ARPPU for Bumble vs Badoo- a typical lifetime premium access for Bumble costs $249 vs $60 for Badoo which operates majorly in Europe and Latin America. 

Industry diagnostic: Into the datingverse

To get some perspective on the potential market opportunity for Bumble, I looked (google searched) at the size of the global dating industry. The size of the online dating industry in 2020 was estimated to be $5.3Bn with North America accounting for 40% of the global dating market. 


Note that the global market is expected to grow faster than North America over the next few years benefitting from the increase in digital penetration. The market is highly competitive with dating apps galore based on regions, demographics and sexual orientation. The largest player in the industry is Match Group. With a mind boggling portfolio of 45 apps (incl. websites) and serving wide spectrum of users, they capture almost 50% of the global market share with revenues of $2.9 Billion (7 out of 10 top apps are owned by Match). The standouts apps and direct competitors to Bumble are Tinder and Hinge. Tinder has been the leader in dating apps and the first mover advantage of inventing the "swipe culture" has yielded significant gains with annualized growth of 42% over last 5 years . Hinge was acquired in 2017 and it's value proposition of meaningful relationship and "Designed to be deleted" tagline has gained popularity with revenues surging 2x over last 3 years.


Based on my understanding of Bumble's business and the industry/competitive landscape, my overarching narrative for the company is summarised in the following themes:

+ Competitive advantage: Fading faster than expected? While Bumble had steadfastly positioned women making the first move as their key differentiating factor vs competitors, there are signs that this might not be the only core strategy endgame with the tacit introduction of Bumble compliments (5 compliments where a user irrespective of gender can make the "first move" to compliment on your profile along with swipe). With 2 out of 3 users on the platform identifying themselves as male and increasing competition from Match, the strategic direction might include "men making the first move" implicitly.

+ Paying users: Macro headwinds to add growth pressure Bumble has maintained an impressive user conversion rate to paying users. However, with increasing stress globally spending due to higher inflation and interest rates, discretionary companies like Bumble will be highly sensitive to cutback in overall consumer spending along with increase in cost of capital. Interestingly, Bumble claims it's potential market size might be as large as streaming services. Although (which is outlandish to say the least), the stagnant or declining user growth across both industries might be the actual overlap in the future.

+ BFF: Platonic relationships might be the key after all Another driver of growth apart from the dating user base could be the BFF feature. Embedded in the broader dating app, the Bumble BFF  provides opportunity to create ang engage communities across different cohorts for networking etc. This might create another additional growth opportunities and enhance user monetisation. But is it proprietary and what stops Match and rest of the competitors to launch something similar?

+ The Badoo factor: Strategic fit or returns laggard While Badoo accounts for ~ 40% of total paying users (1.2M) with a large footprint across Europe and Latin America, it's average revenue per paying user is less than half of Bumble and is a drag on returns. Moreover, the recent quarterly filing indicates a loss of 106K subscribers with a substantial portion attributed to the war in Ukraine. With the acquisition of Fruitz (a dating app popular with millennials in Europe), the strategic narrative for Badoo remains questionable. Currently, it seems like the higher Bumble revenue growth is subsidising Badoo users but this might make the profitability pathway more treacherous going forward

+ Low switching costs: No App to rule the all? One of the perils in the dating app industry is to cultivate a loyal user base. While Bumble and Hinge have been successful to some extent, the fact of the matter is that people use multiple apps at the same time and whichever works first wins. Also, there is a niche of apps which cater to different demographics and preferences. I did a simple test to check this out: downloaded 3 apps, kept my distance for potential matches less than 1 km and started swiping left and right. Unsurprisingly, I was bumping into similar people across these apps. While this test is based on N=1 and is largely unscientific, user retention will be a hard thing in the dating app industry with no one size fits all approach.

The Bumble Narrative

"Bumble is an online dating company which will continue to differentiate itself through it's female centric strategy. It will consolidate its position as one of  the largest but not dominant players in the dating app space globally and generate higher margins through higher paying user conversion. The company will continue to reinvest in technology and risk of failure remains low. However, growth momentum will be challenged by high competition, macroeconomic pressures and changing consumer preferences"    

Crunching the numbers


+ Revenue growth- To estimate the revenue growth for Bumble, I start with the market size estimates of the dating app market. Currently, Bumble has a 13% market share based on the market size of $6 Bn in 2021 Match's share of 50% in 2021. I give Bumble a market share of 20% in year 5 for Bumble i.e. revenues of $2.0 Billion based on expected market size of $9.8 Bn. This leads to annualised growth rate of 26% (vs 29% historical) for the high growth phase and 3% growth rate in perpetuity after year 10. How high is this assumption? If I assume Match's market share to remain constant at around 50%, the annualised growth for them would be 13% per annum based on a higher start base of $3.0 Bn. Therefore, while I am comfortable giving Bumble a higher growth rate during the high growth phase, I am implicitly assuming that they will continue to play second fiddle to Match and it's portfolio of apps.

+ Operating margins-  Currently, the adjusted operating margin excl. one-off items and capitalised for R&D is at 8% (even though the non-GAAP margin is supposedly in high 20's by adding back stock based comp). For the end-state, I assume a pre-tax operating margin of 28.5% in year 10 which is in-line with the average industry margin and also corresponds to the largest player in the market i.e. Match. Essentially, this implicitly assumes Bumble's to continue to sustain/increase payer conversion over time. The profitability trajectory follows a linear increase towards the target margin over the 10 year forecast period.  

+ Reinvestment- The proxy for reinvestment would be capital turnover i.e. for every dollar of capital how much does the company generate in sales. Bumble's capital efficiency is high as they operate on a low asset base and most of the balance sheet is tied up in goodwill. Currently, the sales to capital ratio is 3.4x which I assume as constant over the first 5 years and gradually transitions to 2.0x based on the nature of the business and capital productivity. Post year 10, the reinvestment is driven by an implicit perpetuity ROIC assumption of 22% in line with industry average.

Cost of Capital


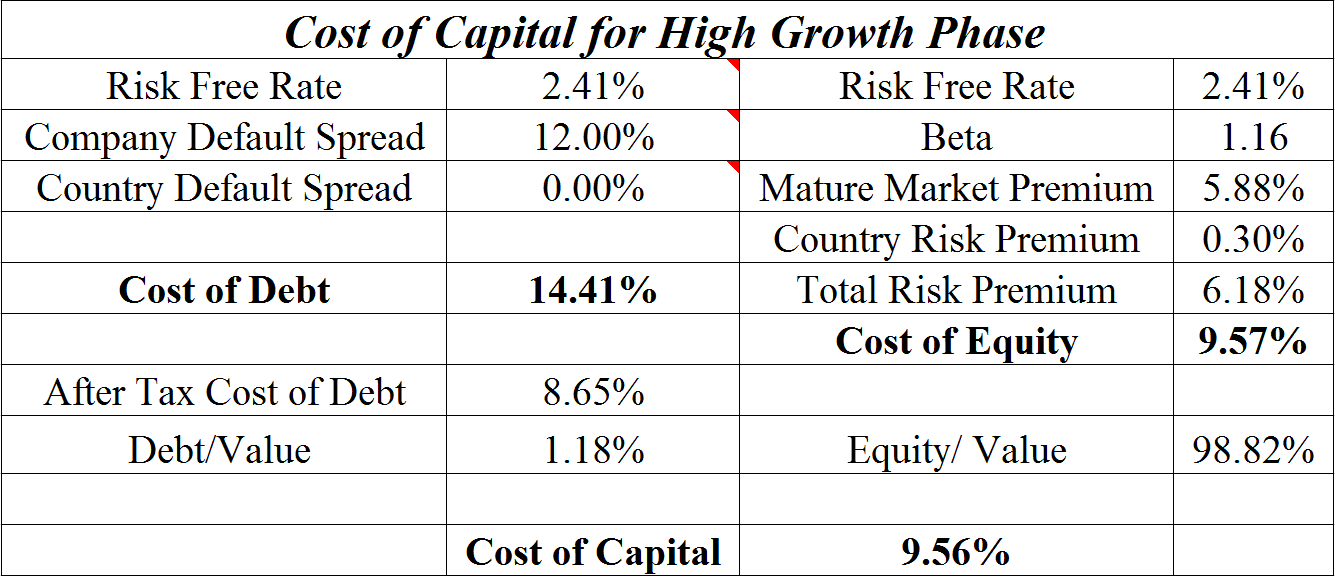
With rising interest rates and tougher macro environment, the cost of capital for Bumble is ~ 9.6%. Note that the company has considerable debt on the books as well which has a below investment grade rating and bulk of the debt is due after 5 years. While this is a red flag, I have assumed that the company will be able to meet it's obligations and incorporated no chance of failure. The cost of capital transitions to ~ 9% in year 10 and beyond which is the median cost of capital for US firms.

From operating value to equity value


Using a 10 year explicit forecast period, I project out the cash flows with the first first 5 years of high growth, transition period from year 6-10 and stable growth period post 10. For the terminal value, growth is capped at the current risk free rate i.e. 2.7%, industry average ROIC of ~ 22% and cost of capital of ~ 9%. The value of operating assets is $6.5 Billion. Subtracting out debt, minority interest and adding back cash and equivalents leads to a value of equity of $5.4 Billion. Taking out the value of options and dividing by the shares outstanding gives me a value per share of  $28 which is ~ 27% lower than the current share price of $38.

Factoring in the uncertainty


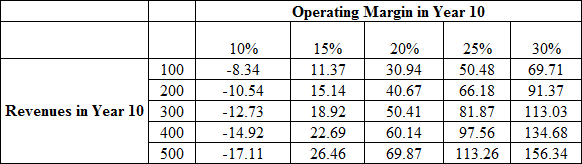
To capture the volatility in my key assumptions, I did a Monte Carlo simulation by assigning distributions to overall market size (lognormal), market share (triangular) and operating margin in year 10 (uniform). This helps me in incorporating the wide values around these key variables rather than just point estimates. After 1 Million simulations, the median share price of $26 is in line with my base case value of $27. Based on my assumptions, the current market price is already around 85th percentile of the distribution. Would I buy the stock at this price? I don't think so- maybe when it is below the median price of $27 or there is a significant change in the narrative. Based on my current narrative and link to numbers, the stock is overvalued by ~ 27%.

Final thoughts

Based on my story for Bumble and the bridge to numbers, the current intrinsic value is low versus the prevailing market price. I think the real test for the company will be over the next few months- with global inflationary pressures and impending drop in global consumer discretionary spending, will the company be able to maintain it's growth trajectory and accelerate path towards profitability? The impact of these macro shifts might influence and possibly pivot my narrative for the dating app industry and Bumble as an investment. The next steps would be to look out for new information in the quarterly earnings and watch out for any company narrative shifts/breaks. Till then, I'll sit back and swipe left on this investment.

Bumble valuation model link


Note: The content on this blog reflects the personal views of the author and should not be considered as an investment advice or recommendation. 

Saturday, 18 February 2017

Snapchat IPO Valuation: Value disappears in 15 seconds?


Snapchat filed for an IPO with the SEC on Februrary 2, 2017 expecting to be priced at $20-$25 Billion from the share offering. I have no clue whether it is fairly priced given that I know very little about the company. Hence, I have decided to value the company more out of curiousity rather than being a prospective investor (I can't invest even if I want to).

The Business Model
Before I dive into number crunching, I need to get a sense of what business they are in, the market size and market dynamics, and identifying their competitors. Going through their S-1 filing with the SEC, The company defines itself as a "camera company" and primarily has three product categories:

1. Snapchat- The camera cum chat application is the main growth driver for the business. The below graph shows the different functionalities of Snapchat:


2. Publisher Tools
This is where Snapchat generates it's revenue. These tools enable companies to create advertisements and these can be targeted to users either using Snap stories above or creating Sponsored lenses and filters wherein companies create a Sponsored lens of their product. Also, They are able to generate revenue through Snap Ads, which are video advertisements played in Snap stories.

3. Spectacles
The first hardware product by the company, Spectacles are essentially sun glasses that enable you to record a snap and wirelessly enable you to add it to the Snapchat App. Launched in 2016,  This is another potential revenue stream for the company.

Market Size and Competition
To come up with an estimate for the market, I did a google search and got my hands on emarketer's estimates (although they are a bit old). As of 2016, the digital mobile advertising market was $101.37 Billion, 40.2% of the total digital advertisement spending. The market is projected to grow at a CAGR of 24% till 2019 whereas the total digital advertising market is projected to grow at an annualized rate of 12%. I have backed out the digital advertising market size using the numbers in the article.


Using this article, I have updated emarketer's estimates for 2016 and 2020. The 2016 year end spending is expected to be $194.60 billion globally and the market is expected to reach a size of $335 billion in 2020. This translates into an annualized growth rate of 14.54%. The high growth in digital advertising is being driven by mobile advertising, which is expected to be 73.7% of total digital advertising market in 2020.

I also had a look at Snapchat's direct competitors in the online advertising space (Mentioned on Page 18 of S-1 filing as well):


Clearly, Google and Facebook account for more almost 55% of the market share based on revenues. Facebook has been paricularly impressive, beating analyst expectations quarter after quarter and is now generating an operating margin higher than Google. Compared to other players, Snapchat is a currently a small player and is making no money. An interesting story here is that of Twitter, The company performance has been continuously going downward and it has failed to capitalize and generate more advertising revenues from its existing user base. With rumours floating around that Twitter is for sale, It will be a huge task for the company to gain market share against competitors like Google and Facebook.

After taking a look at the company's business model as well as the market and competition, My thoughts about the same are summarized below:

1. Competitive Advantages: In my opinion, The two key advantages that Snapchat has are 1) The Snap vanishing in 15 seconds and 2) Potential networking benefits. The App is particularly popular among the age group of 18-24 because the content you send vanishes after 10-15 seconds and in that age group you do tend to send a lot of stuff which you don't want anyone to have a record of. Combining this with potential networing benefits i.e. the popularity among friends acts as an impetus for other friends to join the App. This has enabled the company to have Average Daily Active Users(DAU's) of 158 Million as of Q4 2016.

2. Monetizing Users: Still a long shot?: Although Snapchat has been able to substantially increase it's revenues by almost 700% from 2015 to 2016, I believe there will be challenges in further scaling up the business and increasing revenues. One reason is of course operating in an extremely competitive space and going up against competitors like Google and Facebook. The other concern stems out of their business model. Sponsored filters and lenses are a great tool to spread the awareness of a new product and make it viral but cannot efficiently communicate the different features of the product. Moreover, Facebook through Instagram has brought out it's own Story feature in response to Snap story and get a share of the video advertising pie.

3. Corporate Governance Red Flag: While going through the S-1 filing, A particularly scary information stood out: The shares being offered are Class A shares i.e. these shares do not have any voting rights. The voting power is concentrated in the hands of Evan Spiegel and Robert Murphy through Class C shares, accounting for 88.6% of total voting power. This effectively means that there will be no significant authority to question the co-founders for their business decisions and the goal of creating firm value might get undermined by vested self interests. Therefore, I will have to build this lack of corporate governance in my valuation.

4. The mystery of Spectacles: One potential source of revenue generation that I haven't discussed much is Spectacles. The revenue for Snapchat from spectacles remains minimal as evidenced by their disclosure that the Spectacles revenue was not material in 2016. With a $130 price tag, I find it kind of hard to see it developing in a mass market product. Products similar to Spectacles have not had much success (read Google Glass) and it's main competitor is rear camera of your smartphone. I am not sure whether there is a market there which will actually enable Spectacles to become a huge success, atleast there is no tangible evidence of that yet.

Building the Narrative

My story for Snapchat is as follows:

Snapchat is a social media company which generates it's revenue primarily from online advertising. It will be able to leverage on it's competitve advantages to increase market share. Given it's business model and competition, Snapchat will not be the largest player in the market.

Connecting the Numbers

1. Revenues
I have assumed that Snapchat will generate revenues of $19.81 Billion in Year 10. To come up with this number, I have made the following assumptions:

1. Using emarketer's estimates, I have assumed a annualized growth of 14.54% for the first five years for the digital online advertising market. Therefore, the market size in Year 5 is $383.7 Billion. I give Snapchat a market share of 1.5% in Year 5, which gives me revenues of $5.7 Billion in Year 5. The market share might seem low as I am giving them a share of total digital advertising market, not just mobile advertising. This translates into an annualized growth rate of  70.12% from Year 1 to Year 5.

2. To come up with revenues in Year 10, I linearly decline the growth rate from Year 5 to growth rate of the economy in Year 10 i.e. 2.41%. I am building in the fact that Snapchat's business model and existing competition will be a challenge in increasing number of users and monetizing them. I also believe that given their networking advantages and popularity among the age group of 18-24, they will be able to eat into market share of Twitter, which is grappling with it's own troubles of stagnant revenue growth. Therefore, revenues for Snapchat 10 years from now are $20.29 Billion i.e. 5 years of high growth followed by linear decline to economy growth rate in year 10. The revenue figure is lower than Facebook and Google's current revenues, which means that I am assuming that Snapchat would be a smaller player than both of them.

2. Margins
Currently, Snapchat has an operating margin of -96.68%, which I have adjusted by treating operating leases as debt and capitalizing R&D expenses. I have assumed an operating margin of 22.50% for Snapchat 10 years from now i.e. the average operating margin for internet software firms globally. Being in a highly competitive business, I believe any margins higher than industry average will be hard to come by for Snapchat. I am also factoring in the fact that Snapchat is currently in a high growth phase of it's life cycle and it will be more focused on increasing it's user base. This should translate into more revenues but put pressure on the margins. Here as well, I am giving them an operating margin lower than Google and Facebook.

3. Reinvestment
To come up with Snapchat's renivestment, I have assumed a Sales to Capital Ratio of 1.10 for Snapchat. The current Sales to capital ratio for Snapchat is 0.40 and the global industry average sales to capital ratio is 0.80. I am implicitly assuming that Snapchat will become more efficient over time and will generate higher sales for every dollar of capital invested. The implied return on invested capital in year 10 is 13.99%.

Cost of Capital


Stable Growth Assumptions

1. Growth Rate- I have assumed that growth rate of the company in perpetuity will be equal to the risk free rate i.e. 2.41%.

2. Cost of Capital- I have assumed that debt and equity weights will converge to industry average weights alongwith beta converging to market beta of 1. As the company's borrowing capacity increases when it starts making money, I have also assumed that company default rating will transition from D to Baa3 (the lowest investment grade rating).

3. Return on Invested Capital- This is where I build in my concerns regarding corporate governance issues. Whereas the average internet software company has a spread of 6.50% between return on invested capital and cost of capital, I have assumed only a 4% spread. This will lead to higher reinvestment, lower terminal value and will reduce the value of the firm.

Value of the Firm and Equity
Discounting the Free cash flows to the firm alongwith the terminal value at the cost of capital gives me a firm value of $9.50 Billion. Subtracting out market value of debt of $298.96 million brings me an equity value of $9.18 Billion. Here, I subtract out the value of 22.45 million options outstanding i.e. $174.01 Million and add on cash and marketable securities of $3.98 Billion (which includes $3 Billion that Snapchat will raise from the IPO) to finally arrive at a value of equity of $13 Billion. Dividing this by number of shares outstanding i.e. 1.3 Billion (includes 200 million new shares that will be issued in the IPO) gives me a value per share of $10.01.

Factoring in the Uncertainity

1. Market Implied Variables
Since the issue will be priced between $14 to $16, I have backed out the implied revenues and operating margin in Year 10 using goal seek for a share price of $15. The implied revenues in Year 10 are $33.9 Billion whereas the implied operating margin in Year 10 is 31.30%. Given my narrative about company's business model and the business environment, these figures seem to be overly optimistic.

2. Monte Carlo Simulation
To capture changes in my assumptions, I did a Monte Carlo simulation wherein I gave a uniform distribution for revenues in Year 10 and a triangular distribution for operating margin in Year 10. After 1,000,000 simulations, The median value per share is $8.31. There is a 80% certainty that the value will be between $6.36 and $10.57.


Bottomline

The Snap IPO story is indeed an intriguing one: The company does have competitive advantages that will work for it. However, the real test of scaling up the business begins now. Personally, I believe the IPO will be priced at the lower end of the price spectrum given that the company has more to prove in terms of it's growth story and corporate governance issues stemming out of its shareholding structure. I will be following the company closely after the IPO to see if there is any informaton that might cause me to revisit my story and valuation.

Link to Valuation Model


Note: Please do not consider any content on this blog as an investment recommendation or advice. At the time of posting of this article, I do not have any financial interest in the company being analyzed. The views reflected in this blog are my personal views and have been arrived at using public information sources.


Sunday, 11 September 2016

Startup Mania Part 2: Snapdeal Valuation

One of the early stars of the Indian E-tail story, I have decided to value Snapdeal next. With online retail being touted as the next big thing, It will be interesting to see if the narrative and numbers hold up together or there is a significant disconnect between my Intrinsic value for Snapdeal and VC value. I will be donning the hat of a prospective VC investor for my analysis.

Size of the Market
I again rely on eMarketer's estimates to gauge the size of the E-tail market in India. A good thing about their data is they have segregated the estimates of the online retail market from the total E-Commerce market. This is pretty useful as more than 70% of the E-Commerce market in India consists of travel sales.


As shown by the above data which is based Gross Merchandise Value numbers, online retail market is 1.6% of the total retail market i.e. $13.31 Billion (Rs. 853.7 Billion). Over the 5 year period from 2015-2020, the market is expected to grow at an annualized growth rate of 42.94%. Moreover, Mobile E-Commerce is expected to be the strong driver of growth:


Key observations regarding Industry and Company

1.The "GMV" Illusion: The number being thrown around all the time in E-Commerce and online retail specifically: Gross Merchandise Value. This is essentially the value of goods and services sold over a period of time (Not the price at which you sell them i.e. sales figure). For a pure marketplace model like Snapdeal, Revenues will be a percentage of GMV as a result of commission charged from sellers. Therefore, Value enhancement will only transpire if GMV translates into higher revenues which further lead to higher margins. Companies will surely be priced as a multiple of GMV in the market but I will try not to be distracted by it and keep my focus on revenues and margins.

2.Deep Discounting: The Marijuana Effect: The deep discounting phenomenon has become a part of the industry structure but comes with its own perils. I believe discounting rather than convenience of shopping online has been the primary reason for skyrocketing growth in the online retail industry. This has lured in shoppers in huge numbers at the expense of offline retail. However, this comes at a steep cost of diminished pricing power. In an industry with no significant barriers to entry, cutthroat competition and lot of substitutes, positive margins will be hard to come by as customers chase discounts and when the folk next to you is ready to lose money, only bad things happen (Flipkart example). Discounts are like Marijuana: Once your customers get addicted, it's very hard to get them off it.

3.The wars to come: The 3 big players i.e. Flipkart, Snapdeal and Amazon all are in a growth frenzy, have access to ton of capital and are willing to lose money in order to outdo the other. After a flop show in China, Amazon has come out all guns blazing to capture the gigantic Indian market although it is late to the party (This Fortune article brilliantly summarizes the Amazon Invasion). Moreover, with offline retailers planning to set up their own online portals to get a piece of the pie, it is time to dig deep trenches with capital cushions and weather the inevitable storm.

4.The "Other Expense" Disguise: What particularly stands out on Snapdeal's income statement is the mind boggling other expenses of Rs.1.8 Billion. Luckily for me, they do break out the components of other expenses in their report and lo and behold, advertising promotional expenses comprise the majority chunk i.e. Rs 1.05 Billion (almost a 10 fold increase from last year). This figure would include the discounts bundled to the sellers as well as heavy print, TV and digital advertising by the company.

I also had a look at the current market share of the largest players in the market:


Since revenue numbers are not available on an industry level, I had to work with GMV numbers. As per latest numbers, Flipkart is the market share  with a 30% market share. Snapdeal has already lost its number 2 position to Amazon and even Paytm has overtaken it. I also computed Revenues as a percentage of GMV number to get a sense of the conversion rate. All these numbers above are rough estimates which I got my hands on through various news stories and google search.

Considering the not so insightful observations above, my narrative for Snapdeal is as follows:

Snapdeal is an online marketplace operating in an industry with high competition. Low pricing power and low barriers to entry will only enable Snapdeal to maintain it's current market share as the market size expands.

The Number Crunching

1. Revenues
I have assumed revenues of Rs 359.50 Billion for Snapdeal in Year 10. The way I come up with that number is listed below:

1. I have assumed a 5 year high growth phase for the industry. As discounts start to wither out, the growth rate in GMV will decline. The growth rate for the industry in the future will be a function of internet penetration (huge infrastructure investments), Banking penetration(as Cash on Delivery is eventually phased out) and higher disposable income among consumers. While these all can probably happen, I believe there are a lot of combination of factors here at play along with roadblocks in terms of quality of internet access (speed and continuous access). Therefore, drawing on eMarketer's estimates till year 5 and reducing the growth rate to economy growth rate from Year 6 to Year 10, I get a market size of $136.89 Billion (Rs 8,780 Billion).

2. With Snapdeal, I assume the same growth pattern as for the industry: 5 years high growth phase followed by a linear decline to economy growth in perpetuity. With Snapdeal losing market share to Amazon and Paytm, The best case for the company will be to consolidate it's market share as focus shifts from GMV to margins. I have assumed the current GMV market share for the company in Year 5 i.e. 10%. Thus, My Year 5 GMV market share for Snapdeal is $7.94 Billion. Building on this, I give them a conversion rate of 20% in Year 5. I am implicitly assuming that they will translate more of GMV into revenues sooner than later. Hence, I am assuming a Revenue CAGR of 67.79% from Year 1 to Year 5 and then linearly decline the growth rate to economy growth rate of 4.69%. I finally end up with a revenue figure of Rs 359.54 Billion in Year 10.

How comfortable am I with these numbers? Assuming a modest revenue conversion rate of 30% in Year 10, The total market size by revenue will be Rs 2400 Billion. This gives me a market share of 15% by revenue in Year 10 for Snapdeal and I can live with that number. Can I be wrong? Of course! Will I be wrong? Most probably. But I take solace in the fact that bankers and consultancy firms are also pretty unsure about the size of the market which is a key driver. (Check this out)

2. Margins
I ran into a bottleneck while coming up with an estimate for operating margin in Year 10: Which classification is more suitable for the company: Online Retail or Internet Software? I made a judgement call and have considered it as an internet software company. Operating as a pure online marketplace, the company has more in common with a company such as Ebay rather than a retail company. I give them an operating margin of 20.68% in Year 10 i.e. the average operating margin of internet software firms globally.

3. Reinvestment
To come up with reinvestment number, I have assumed a sales to capital ratio of 1.50 for Snapdeal. This number is higher than the global industry average of 0.78 and emerging markets industry average of 1.06. I am implicitly assuming that the company will become increasingly efficient in generating revenue for every Rupee in invested capital (Although this is more of leap of faith than anything else).

Cost of Capital


Stable Growth Assumptions

1. Growth Rate- The growth rate in perpetuity has been set equal to the risk free rate i.e. 4.69%.

2. Cost of Capital- I assume that debt and equity weights will converge to industry average weights of 4.43% and 95.57% respectively. I also assume that Snapdeal will have more borrowing capacity as it starts to make money and hence decline the company default spread to 2.44% (the default spread for Baa3 rating i.e. the current sovereign rating for India).  This leads to a decline in the cost of capital from 17.92% to a cost of capital of 14.19% in perpetuity.(linear decline from Year 5 to Year 10).

Value of Firm and Equity
Discounting the Free cash flows at the cost of capital gives a value of operating assets of Rs 26.16 Billion. This is the value of Snapdeal based on standalone numbers. As per financial statements, they have 6 subsidiaries and 1 Joint Venture. I convert the book value of these subsidiaries into market values using the average Price to Book ratio for the sectors in which they operate. This process yields a value of Rs 2.2 Billion for the subsidiaries. Subtracting the market value of debt and adding the value of subsidiaries to the value of operating assets along with cash and liquid investments worth Rs 32.8 Billion gives a value of equity of Rs 60.96 Billion. In dollar terms, The Value of equity is $950 Million.

Factoring in the Uncertainty

1.Implied Variables
As per news reports, Snapdeal is being currently valued at $6.5 Billion (Rs 416 Billion). To come up with this value, I backed out the operating margins and Revenues in Year 10 that were being implicitly assumed using goal seek. The implied revenue figure comes out to be Rs 3,687 Billion and implied operating margin is 71.87%. Given my narrative and estimates of market size, Revenues of $57 Billion and such a high operating margin are highly unlikely given the high competition and low barriers to entry.

2. Data Table
I used revenues and operating margins as my two variables in the data table:


Even with a highly optimistic scenario, Snapdeal's value will be Rs 156.34 Billion or $2.43 Billion. This falls way short of the current $6.5 Billion valuation being attached. I believe the size of the market will play a crucial role in determining revenues and value for Snapdeal. I am comfortable with my margin assumption of 20.68%, which to be honest is still a bit optimistic.

3. Monte Carlo Simulation
To capture variations in my assumptions, I did a Monte Carlo Simulation wherein I gave a Triangular Distribution to both Year 5 Market Size (This is the number everyone is uncertain about) and Operating Margins in Year 10. Because I gave a distribution to market size in Year 5, this implicitly checks for changes in my revenue numbers as well. After 1,000,000 simulations, I get a average value of Rs 56.92 Billion  and there is a 80% certainty that the value will lie between Rs 36.16 Billion and Rs 79.36 Billion.


Final Thoughts
As per my narrative and numbers, Another startup fails the Unicorn test although not by much. I believe these are testing times for the company as well as the industry as everyone is hell bent on "Winner takes all" approach. I do not think the industry as a whole will not disappear, they do have changed the way we purchase products. However,  How quickly will the players be able to shift focus from lack of sustainable competitive advantages like discounting to actual competitive advantages like convenience and quick delivery will be the key for future growth.  I will be looking forward to get my hands on any updated numbers for the company or any narrative changes which might force me to revisit my valuation again.

Link to Valuation Model

Note: Please do not consider any content on this blog as an investment recommendation or advice. At the time of posting of this article, I do not have any financial interest in the company being analyzed. The views reflected in this blog are my personal views and have been arrived at using public information sources.